Introduction
I’ve always been somewhat of a casual numismatist. Not fanatical or anything, but I suppose coins have always been kind of interesting to me because each one carries its own guarded piece of history made up of the countless interactions that others have had with it. It’s fun to imagine who’s hands some particular coin has passed through, what they may have bought with it, and what their lives were like. Going through that thought process always made it all the more exciting that the coin was passed on to me and that my life was now a part of its story. Another aspect that made coin collecting fun for me was hunting for U.S. coins made with 90% silver in my spare change, which are increasingly seldom found in circulation.
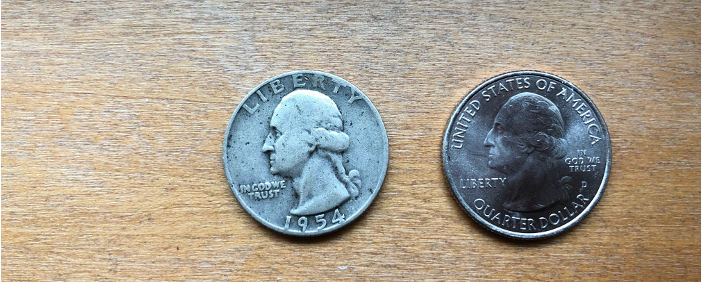
Buuuut, I don’t want to get all sentimenal and philosophical here. Today I want to look at the relatively recent history of the production costs of U.S. mintage, specifically U.S. quarters. I’ll be looking at quarters from 2 different time periods: 2000-2016 and 1932-1964. You might be wondering about the significance of those timespans. Excellent question! 1932 was the first year when the quarter as we know it today in and art (though not necessarily composition, more on that soon) was minted, with George Washington’s bust on the obverse and the bald eagle on the reverse side of the coin. It’s worth noting that the quarters minted from 1932-1964 were composed of 90% silver and 10% copper, weighing in at a total of 6.25 grams- while the quarters from onwards weigh only 5.67 grams and are made of cupronickel (copper-nickel), with 8.33% of it being nickel.
Since a lot of the data we’d normally use to reverse engineer costs is already provided for us and thus so are the what and how components, this post will be more of a history lesson with explantions for why things turned out the way they did. Enjoy the ride!
2000-2016
Okay, let’s start with 2000-2016. Time to dig around the U.S. Mint site. Looking at the production reports section, I see that the earliest report that they have available is from 2001. That’s great, but what about all of the years before that? Did they not start keeping records until 2001? Reading through the 2001 report, I see this
The following supplemental schedules were prepared in compliance with the new reporting requirement per Public Law 106-445 Section 5134(e)(2) of title 31, United States Code that was amended in FY 2000, which required the United States Mint to include in its annual report specific information regarding the costs and expenses for producing, marketing, and distributing circulating coinage — both in gross and on a per-unit basis — as well as gross revenue from the sales of each denomination.
Well that explains it! Excuse me one moment as I take the time to scour through 17 years of reports to aggregate and distill the important stuff.
…
I’m back, and here’s what I gleaned:
| Year | # Produced (MM) | Unit Cost | General & Administrative | Distribution Cost | Total Costs | Revenue (MM) | Profit (MM) |
|---|---|---|---|---|---|---|---|
| 2000 | 6167.6 | $0.0429 | not provided | $0.0009 | $0.0438 | $1541.9 | $1266.5 |
| 2001 | 5528.8 | $0.0517 | not provided | $0.0007 | $0.0524 | $1382.2 | $1080.4 |
| 2002 | 3616.0 | $0.04 | $0.0229 | $0.0008 | $0.0637 | $904 | $669.9 |
| 2003 | 2471.6 | $0.0452 | $0.0229 | $0.0008 | $0.0689 | $617.9 | $427.4 |
| 2004 | 2241.6 | $0.0466 | $0.0257 | $0.001 | $0.0733 | $560.4 | $395.9 |
| 2005 | 2655.6 | $0.0491 | $0.0212 | $0.0014 | $0.0717 | $663.9 | $467.2 |
| 2006 | 3004.4 | $0.0681 | $0.0211 | $0.0015 | $0.0907 | $751.1 | $478.4 |
| 2007 | 2711.2 | $0.0841 | $0.0125 | $0.0012 | $0.0978 | $677.8 | $412.5 |
| 2008 | 2510.4 | $0.0925 | $0.0153 | $0.0012 | $0.109 | $627.6 | $354.1 |
| 2009 | 965.2 | $0.0816 | $0.0298 | $0.0017 | $0.1131 | $241.3 | $132.2 |
| 2010 | 252.8 | $0.0956 | $0.0302 | $0.002 | $0.1278 | $63.2 | $31 |
| 2011 | 324.0 | $0.0923 | $0.0176 | $0.0015 | $0.1114 | $81 | $45 |
| 2012 | 486.8 | $0.0943 | $0.0171 | $0.0016 | $0.113 | $121.7 | $66.8 |
| 2013 | 1062.4 | $0.0903 | $0.0135 | $0.0012 | $0.105 | $265.6 | $154.1 |
| 2014 | 1684.0 | $0.0775 | $0.0109 | $0.0011 | $0.0895 | $421 | $270.5 |
| 2015 | 2645.2 | $0.0755 | $0.0076 | $0.0013 | $0.0844 | $661.3 | $438.1 |
| 2016 | 2483.2 | $0.0672 | $0.008 | $0.0011 | $0.0763 | $620.8 | $431.4 |
I have some observations…maybe questions too.
General and Administrative costs have been dropping
Looking at the table, over the past 16 years the overhead associated with manufacturing a quarter has gone down by quite a bit, from $0.0229 in 2002 to $0.0008 in 2016. That’s a 96.5% reduction in costs! Props to the Mint for being able to accomplish that. Now I’m wondering how they were able to do that. Starting in 2003, in the introduction to the manufacturing report, the 37th Director of the U.S. Mint, Henrietta Holsman Fore opens with this:
Dear Customers and Colleagues,
…
To meet the challenges that lie ahead, we have set priorities for the organization to help us capitalize on opportunities, reduce expenses, and measure our progress both internally and against world-class organizations in an effort to continuously improve business operations.
We have defined a clear vision and outlined strong, focused priorities to become more efficient and add more value to the work we do while meeting or exceeding the expectations of those who work with us.
So we can see that there was a clear focus on cutting costs and becoming more efficient early on. It seems like whatever initiatives she implemented to do this were working, up until 2008. By 2007 the general and administrative costs had dropped to $0.0125/coin, before sharply climbing to $0.0302 between 2008 and 2010. Perhaps this excerpt from 2008 can explain the increase in cost?
Unfortunately, lower volumes means that we must allocate our fixed costs over fewer units, offsetting the benefit of lower metal prices.
That checks out because production numbers did decrease from previous years in 2008, a trend that continued to get worse up until about 2012.
In any case by 2016 general and administrative costs had dropped to $0.0008. From this line in the 2015 report, I guess the Mint just got really good at controlling costs. The increased production figures over time probably contributed too.
The Mint controlled indirect costs, allowing the increased shipments to generate more seigniorage.
Regarding low production numbers from 2009-2012
While other years (including those after 2012) had at least 1.5 billion quarters minted, this time period only saw ~2 billion quarters minted between all 4 years! I’m reminded of a line I saw in the 2002 report.
The demand for circulating coins is directly related to the economy. Since mid-2000, when the U.S. economy began to slow, demand for coins decreased.
Well we did have a pretty bad financial meltdown that turned into the Great Recession in 2008, now that I think about it. Let’s crack open the 2009 report to find out more, since these reports have a fiscal year ending on September 30th and the 2008 financial crisis didn’t occur until October.
Mint Director Edmund C. Moy drops this on us:
The big story in Fiscal Year (FY) 2009 was the recession. The United States Mint is no stranger to recessions, as we’ve survived and thrived through 33 of them since 1854. But the severity and rapidity of this recession challenged us and affected all three lines of our coining operations.
Makes sense. I wonder exactly how that directly affected coin production?
Our circulating coin production was at a 45-year low with fewer cash transactions because of the slow economy and Americans cashing in coins they’d been saving.
If money isn’t exchanging hands, I suppose it doesn’t make sense to mint more.
Do unit costs track the spot price of metals the coin is composed of?
Remember how I mentioned earlier that modern quarters are composed of cupronickel (copper + nickel)? I compiled the market prices for nickel and copper going back to 2005 and averaged the closing prices for both per month- then I took those numbers and averaged them per year. The following graph shows the percentage change on a yearly basis in the prices of both metals, overlayed with the percentage change in the cost of making a quarter. For those on mobile the blue line is nickel, the brown line is copper, and the black line is the change in cost of making a quarter. I scraped the copper and nickel prices from these tables kindly publicly provided by Business Insider.
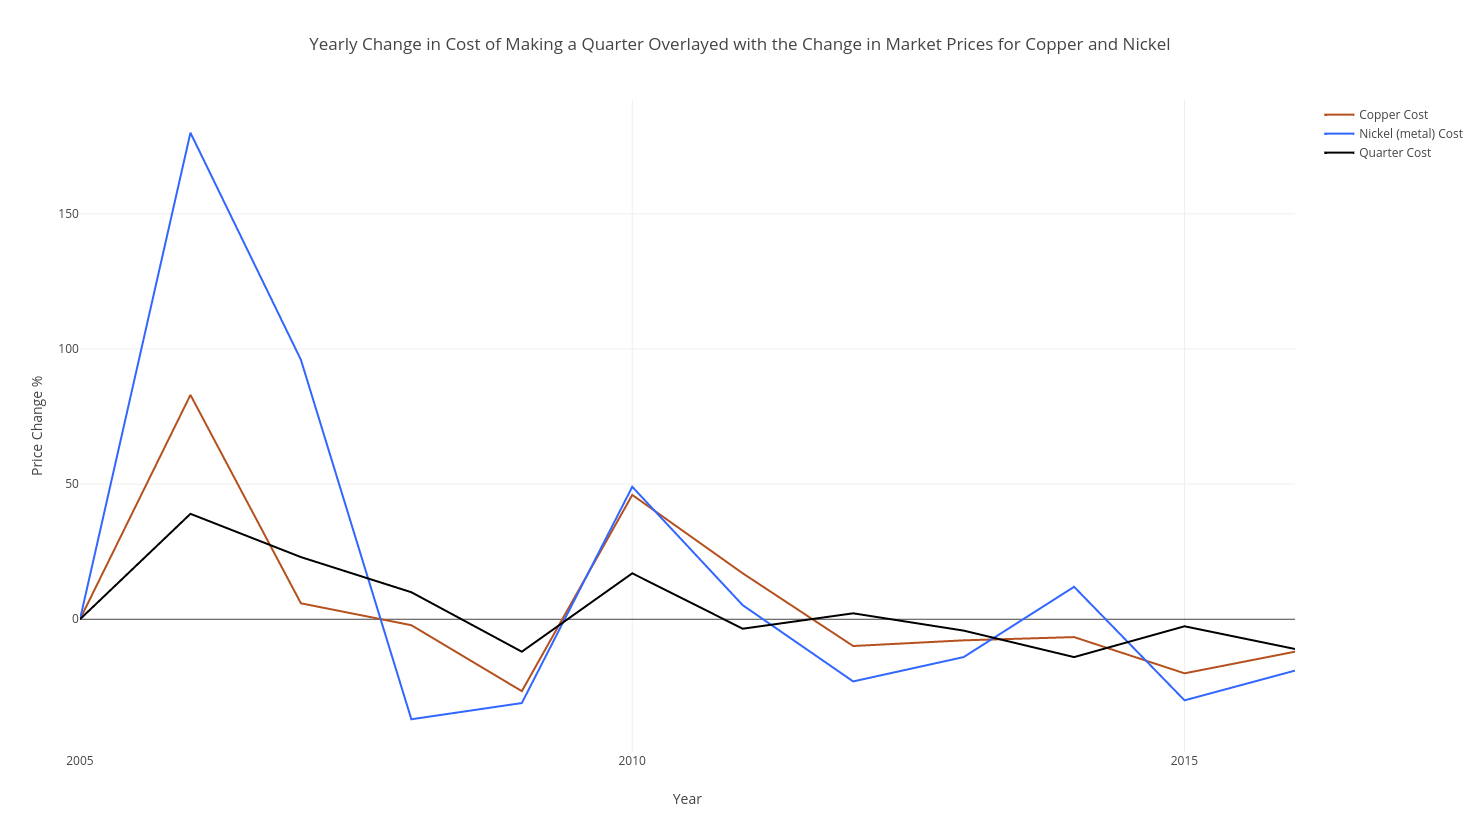
Interestingly enough, changes in the cost of making a quarter seem to track the changes in price for copper and nickel. After 2012, the price changes in the cost of these metals seem to decrease less, but ultimately are still negative.
The cost of making a quarter appears to be most influenced by the swings in the price of copper. This makes sense, since quarters are 92.67% copper, with only 8.33% being nickel. It’s a good thing too- just look at that 150% price swing between 2005 and 2006 in the price of nickel. That peak is huge!
The unit cost of making a quarter in 2016 was the lowest it’s been since 2005. Why?
From 2012-2016 prices for both metals saw relative consecutive decreases ranging from -9% to -30%. I’d guess that that has a lot to do with it.
Look at that seigniorage!
Something that makes sense but never really ocurred to me is that if the government can produce currency for cheaper than it sells that currency (at face value), then they’ve made a profit. As it turns out there’s a word for that, and it’s called seigniorage. Did you know that? I didn’t know that. Good for you if you did. In fact, I’m kind of curious as to how many people have that word in their lexicon. Do me a favor and post in the comments whether or not you already knew that word.
Anyway looking at the profit column in the table, the Mint earns hundreds of millions of dollars each year in seigniorage.
/u/born_lever_puller, a moderator at /r/Coins on Reddit reached out to me and had more insights to provide on seigniorage:
Before the days of income tax, seigniorage - the difference between the total cost to produce a coin and its face value, was a way for governments to replenish their treasuries.
So people would bring their silver to the mint to have it assayed and made into government-issued and certified legal tender - which was important for commerce, but the government kept some of it for themselves. In the early days the US Government didn’t have access to silver or gold bullion in adequate quantities and relied on miners or traders to sell it to them. There is good evidence that some of the first coins struck by the US government used Martha Washington’s own household silverware - fancy tea pots, urns, pitchers, serving dishes, platters, utensils, and that kind of stuff.
1932-1964
Here’s the fun part. The U.S. Mint didn’t start releasing cost and production data until 2002, when a law passed requiring it to do so as we learned above. That means that we’ll have to reverse engineer the data.
How much did it cost to produce quarters from 1932 - 1964?
Since quarters made during this era were 90% silver and 10% copper, I’ll start by looking at silver and copper prices for the same period. We’re looking at a timespan of 32 years, so to save time and simplify the presentation (we’re only estimating after all!) I’ll sample 2 years from the start and end of each decade like so:
- 1932 & 1939
- 1940 & 1949
- 1950 & 1959
- 1960 & 1964
To get the cost of each metal in the quarter, I’ll be using this formula: [% of metal in quarter] * [metal price/gram] * 6.25g.
Looks like by the time the U.S. Mint was ready to end production of quarters with silver in them, the cost of silver in a quarter had already risen to $0.23!
| Year | Silver Cost* | Copper Cost* | Total Quarter Cost |
|---|---|---|---|
| 1932 | $0.051 | $8.0e-05 | $0.05108 |
| 1939 | $0.071 | $0.00015 | $0.07115 |
| 1940 | $0.063 | $0.00016 | $0.06316 |
| 1949 | $0.13 | $0.00027 | $0.13027 |
| 1950 | $0.13 | $0.0003 | $0.1303 |
| 1959 | $0.16 | $0.00043 | $0.16043 |
| 1960 | $0.16 | $0.00045 | $0.16045 |
| 1964 | $0.23 | $0.00045 | $0.23045 |
*Historical prices for silver and copper obtained from the U.S. Geological Survey.
Obviously with silver prices rising, continuing production was going to be unsustainable- and that’s just the cost of the materials. If we added general, administrative and distribution costs, it would certainly cost more to make a quarter than a quarter is actually worth.
Why were quarters initially only 90% silver?
I mean, why not just go 100%, ya know? Alexander Hamilton may be able to tell us. In his addressal to the 1st congress of the United States on January 28, 1791 he says
It is sometimes mentioned, as an expedient, which, consistently with a free coinage, may serve to prevent the evils desired to be avoided, to incorporate in the coins a greater proportion of alloy than is usual; regulating their value, nevertheless, according to the quantity of pure metal they contain. This, it is supposed, by adding to the difficulty of refining them, would cause bullion to be preferred, both for manufacture and exportation.
Initially I thought the answer was to prevent people from melting the coins down for bullion and manufacturing purposes, therefore taking the coins out of circulation. As it turns out, I misunderstood Hamilton. /u/born_lever_puller who I quoted earlier enlightened me on the 2 primary reasons why the U.S. minted coins using a silver alloy instead of pure silver.
The first is that silver is quite soft and would be a poor choice of metal for usage in a coin that’s meant to be tossed around in circulation for decades to come. The other reason is that during the early days of the U.S., the colonies had to rely heavily on imports, as they lacked many of their own resources. Had they minted 100% pure silver or gold coins to pay for these imports, it’s highly probable that the coins would have been kept by the exporting countries and would not have made their way back into circulation in the U.S. This was important because during that period there was a shortage of precious metals in the colonies and the U.S.’ minting facilities were still in their infancy, being unable to keep up with demand.
Wrap Up
I really appreciate you making it this far, and I hope you had as much fun reading through this as I did writing and discovering the information. Next week, there’s something somewhat obscure and overlooked that I want to learn and break down the cost of.
I forgot to mention, quarters were not the only ones to contain actual silver in them at some point. Dimes and half-dollars did as well during the same period. If you’re interested in starting your own silver coin collection, it’s relatively cheap to do so and you can buy coins on Amazon here.
If you enjoyed this, check out my last post where I tried (and mostly failed, but it was fun!) to guess how much it costs to make a leather wallet. Thanks for reading and stay stuned for more!